 Farshad Ghobadvand
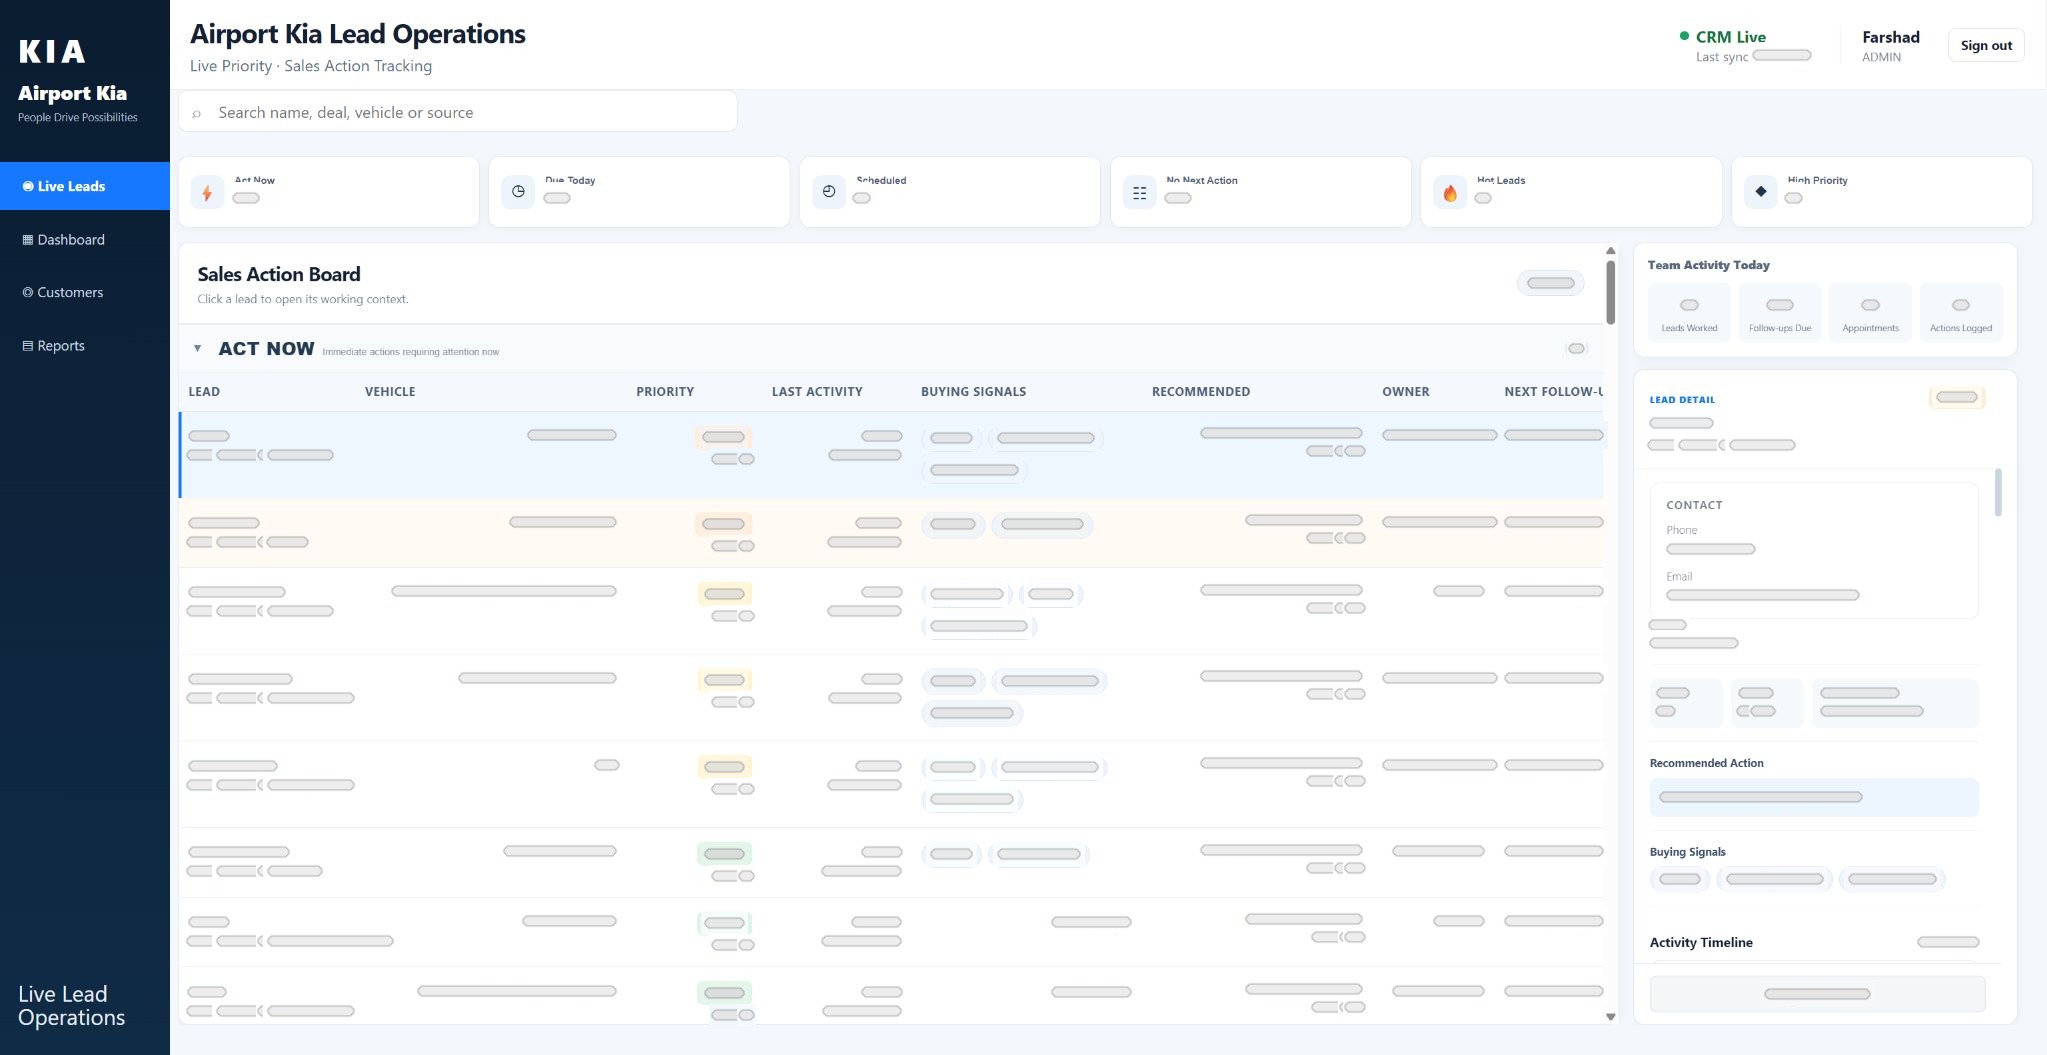
For August 1 to October 29, new leads recorded in Airport Kia’s CRM increased from 644 in 2025 to 1,383 in 2026. That is an additional 739 leads, or 114.8% year over year, across the matched reporting windows.
The useful part of this example is also the method behind the comparison. Before explaining a growth percentage, I establish the dates, counting basis and scope. That makes it clearer what the result measures and which questions need further evidence.
Match the reporting window and the counting basis
Both years use August 1 through October 29, including October 1–29 in each year. The lead-recording and counting basis was confirmed as comparable. Those details are part of the result because a different date window or definition would change the comparison.
I would document the same points in any CRM analysis: the exact start and end dates, what constitutes a new record and which sources are included. This provides a common starting point for marketing, sales and anyone reviewing the report.
- Use matching start and end dates.
- Confirm that the lead definition is comparable.
- State whether the count includes all sources or a defined subset.
Show the breakdown as well as the total
The monthly rows give the total more context. August increased from 265 to 468 leads, September from 212 to 428, and October 1–29 from 167 to 487. The corresponding increases are 76.6%, 101.9% and 191.6%.
Across the three rows, the totals are 644 and 1,383. Calculating the increase against the earlier total gives 739 divided by 644, or 114.8% after rounding to one decimal place. This is the overall year-over-year change for the reported window; October has its own separate comparison.
Give attribution and quality their own analysis
These figures measure total new CRM leads across all sources. They do not identify how much of the change came from an individual paid campaign, a particular tool or one person’s work. That question needs source-level and campaign-level evidence.
Lead quality and sales outcomes also need their own definitions. A total new lead count is different from a qualified lead, appointment or sale. Similarly, a lower-budget or cost-per-lead claim would require comparable spend, scope, currency and conversion definitions.
My responsibilities span Google Ads, Meta Ads, SEO, local search, website work, measurement, CRM workflows and lead operations. I present that contribution alongside the CRM comparison while keeping the observed total and the attribution question distinct.
Use the comparison to choose the next review
After establishing a comparable result, I look at the next question the business needs answered. That could involve source coverage, the context captured with an enquiry or the way the next follow-up is assigned. The aggregate helps frame the investigation.
A useful report therefore includes the result, the basis of comparison and the evidence needed for the next decision. This makes the growth figure something a team can examine and discuss alongside the operational work that follows an enquiry.
Key takeaways
- Use matched dates and a consistent counting definition.
- Show the monthly breakdown behind an aggregate percentage.
- Keep total leads distinct from paid attribution, quality and sales outcomes.
- Use the result to frame the next evidence-based review.
Sources & further reading
Expanded from my authored CRM lead-growth analysis. The figures are approved aggregate counts from a CRM comparison with confirmed matched dates and counting basis; customer records are not published.